19 - Use the Azure TCO Calculator (10 min)
In this walkthrough, you will use the Total Cost of Ownership (TCO) Calculator to generate cost comparison report for an on-premises environment.
Note: This walkthrough provides example definitions of on-premises infrastructure and workloads for a typical datacenter. To create a TCO Calculator report, use the example definitions or provide details of your actual on-premises infrastructure and workloads.
Task 1: Configure the TCO calculator
In this task, we will add infrastructure information to the calculator.
-
In a browser, navigate to the Total Cost of Ownership (TCO) Calculator page.
-
To add details of your on-premises server infrastructure, click + Add server workload in the Define your workloads pane.
Settings Value Name Servers: Windows VMs Workload Windows/Linux server Environment Virtual Machines Operating system Windows VMs 50 Virtualization Hyper-V Core(s) 8 RAM (GB) 16 Optimize by CPU Windows Server 2008/2008 R2 Off -
Select + Add server workload to make a row for a new server workloads definition.
Settings Value Name Servers: Linux VMs Workload Windows/Linux server Environment Virtual Machines Operating system Linux VMs 50 Virtualization VMware Core(s) 8 RAM (GB) 16 Optimize by CPU Windows Server 2008/2008 R2 Off -
In the Storage pane, click Add storage.
Settings Value Name Server Storage Storage type Local Disk/SAN Disk type HDD Capacity 60 TB Backup 120 TB Archive 0 TB -
In the Networking pane, add bandwidth.
Settings Value Outbound bandwidth 15 TB -
Click Next.
-
Explore the options and make any adjustments that you require.
Settings Value Currency Euro -
Click Next.
Task 2: Review the results and save a copy
In this task, we will review cost saving recommendations and download a report.
-
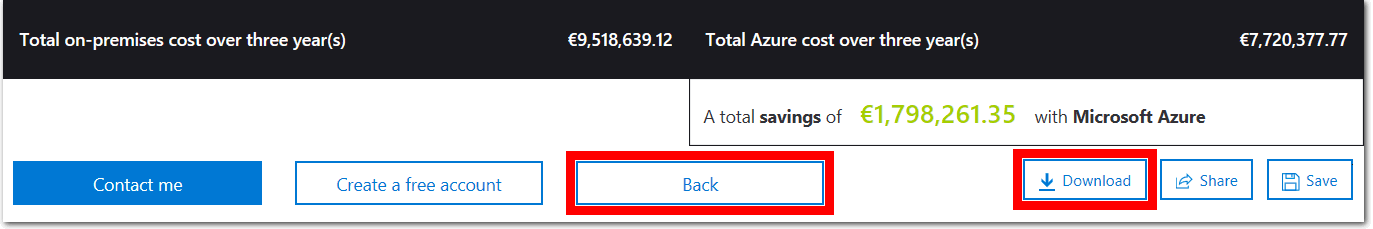
Review the Azure cost saving recommendations and visualizations.
Settings Value Timeframe 3 years Region North Europe -
To modify the information you provided, go to the bottom of the page, and click Back.
-
To save or print a PDF copy of the report, click Download.
Congratulations! You have used the TCO Calculator to generate a cost comparison report for an on-premises environment.